GraphPad Prism 破解版 专业强大的医学绘图软件
发表于: 2019-06-21 其他软件 mac
Prism是一款Mac上专业强大的 医学绘图 软件,是基于生物统计,曲线拟合和科学绘图于一体的综合性方案的强大组合,中文名【棱镜】,在医学领域是非常出名的一款科学分析统计软件,非常不错!
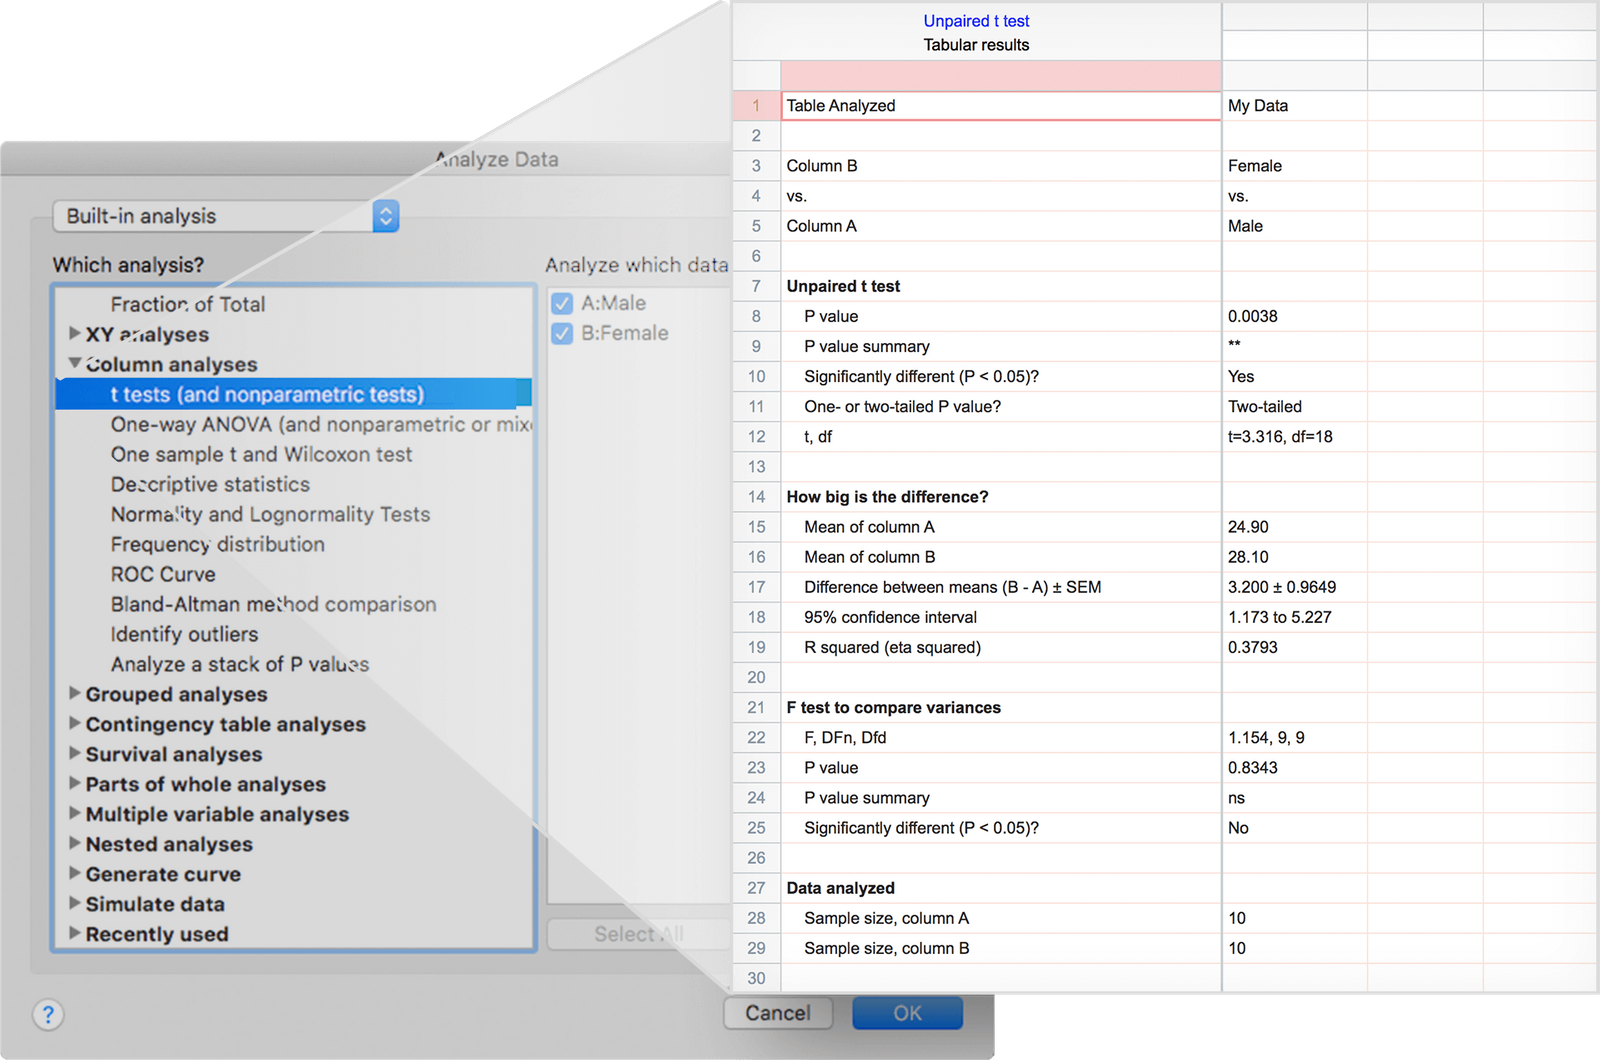
Prism is a powerful combination of biostatistics, curve fitting (nonlinear regression) and scientific graphing in one comprehensive program. Easily organize, analyze and graph repeated experiments; pick appropriate statistical tests and interpret the results.
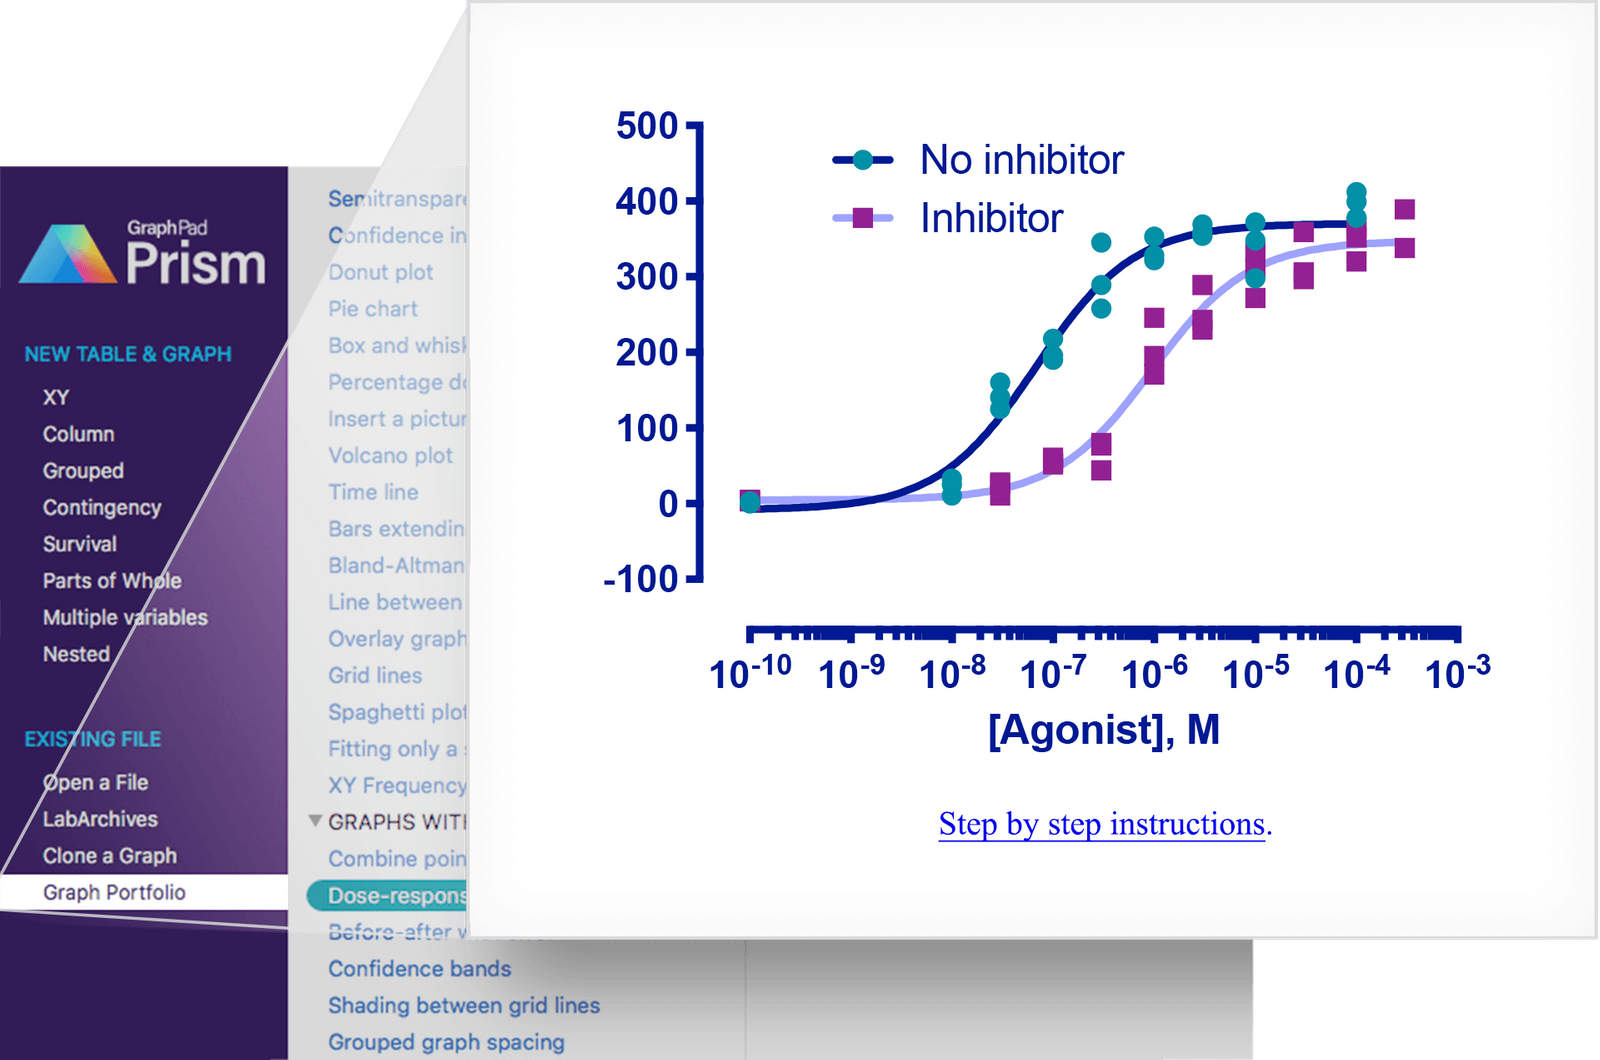
Nonlinear regression is an important tool in analyzing data, but is often more difficult than it needs to be. No other program simplifies curve fitting like Prism. In fact, you can usually fit curves in a single step. Just select an equation from the extensive list of commonly used equations (or enter your own equation) and Prism does the rest automatically -- fits the curve, displays the results as a table, draws the curve on the graph, and interpolates unknown values.
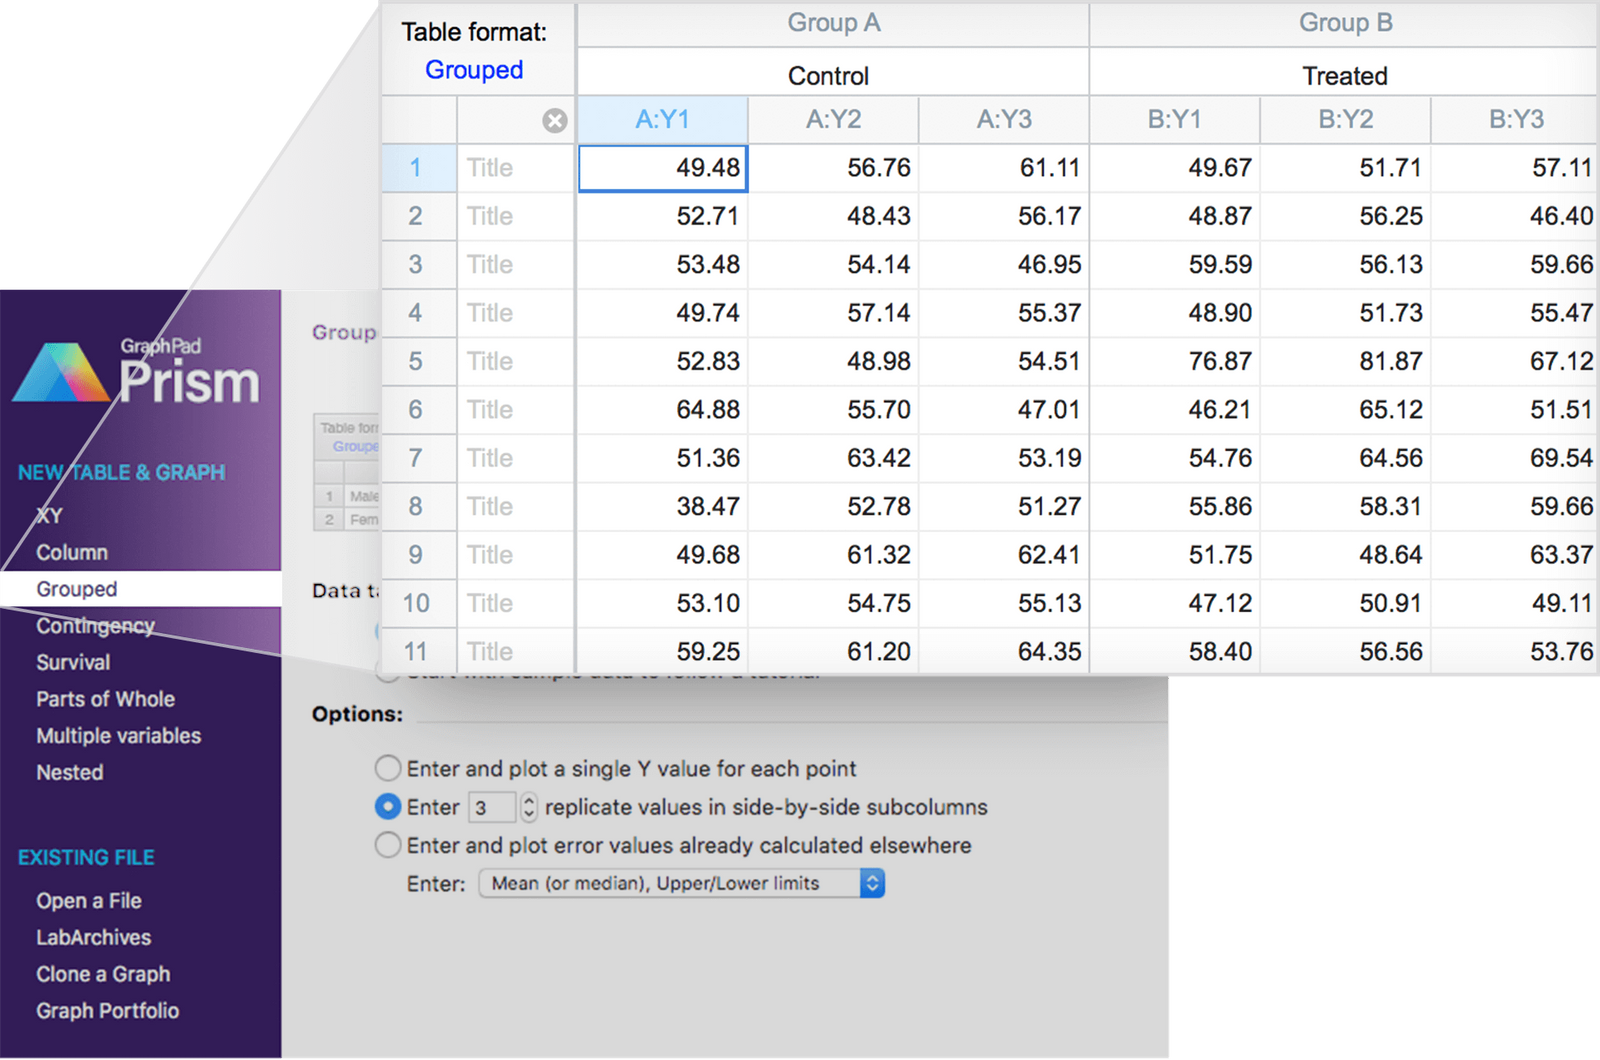
Place data for multiple data sets side-by-side on an organized data table, and Prism can fit them all the data sets at once. You can fit the same model separately to each data set, use global nonlinear regression to share parameter values among data sets, or fit different models to different data sets.
Don't be fooled by the simplicity. Prism also gives you many advanced fitting options. It can report the confidence intervals of the best-fit parameters as asymmetrical ranges (profile likelihood method), which are far more accurate than the usual symmetrical intervals. It can also automatically interpolate unknown values from a standard curve (i.e., to analyze RIA data), compare the fits of two equations using an F test or Akaike's Information Criterion (AIC), plot residuals, identify outliers, differentially weight data points, test residuals for normality, and much more.